Without the help of programmers, I can produce the data and chart results I want step by step, and I don't have to consider which GIS software to use. It's like finding a smart assistant to work with!
Feedback from customers - 2023/12/12
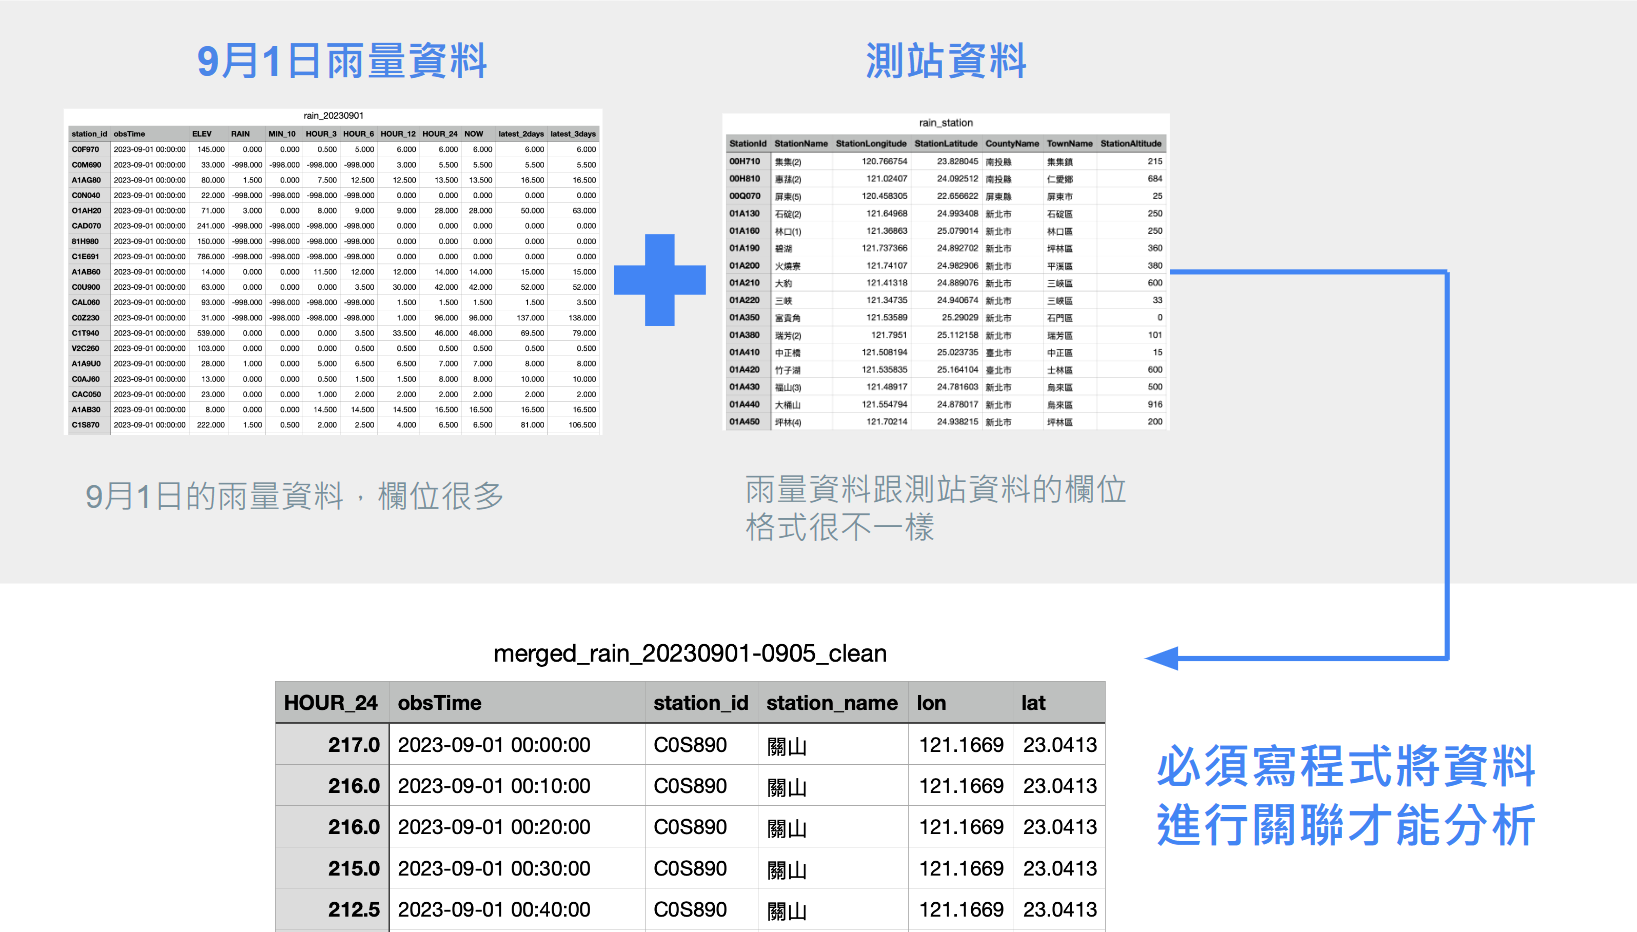
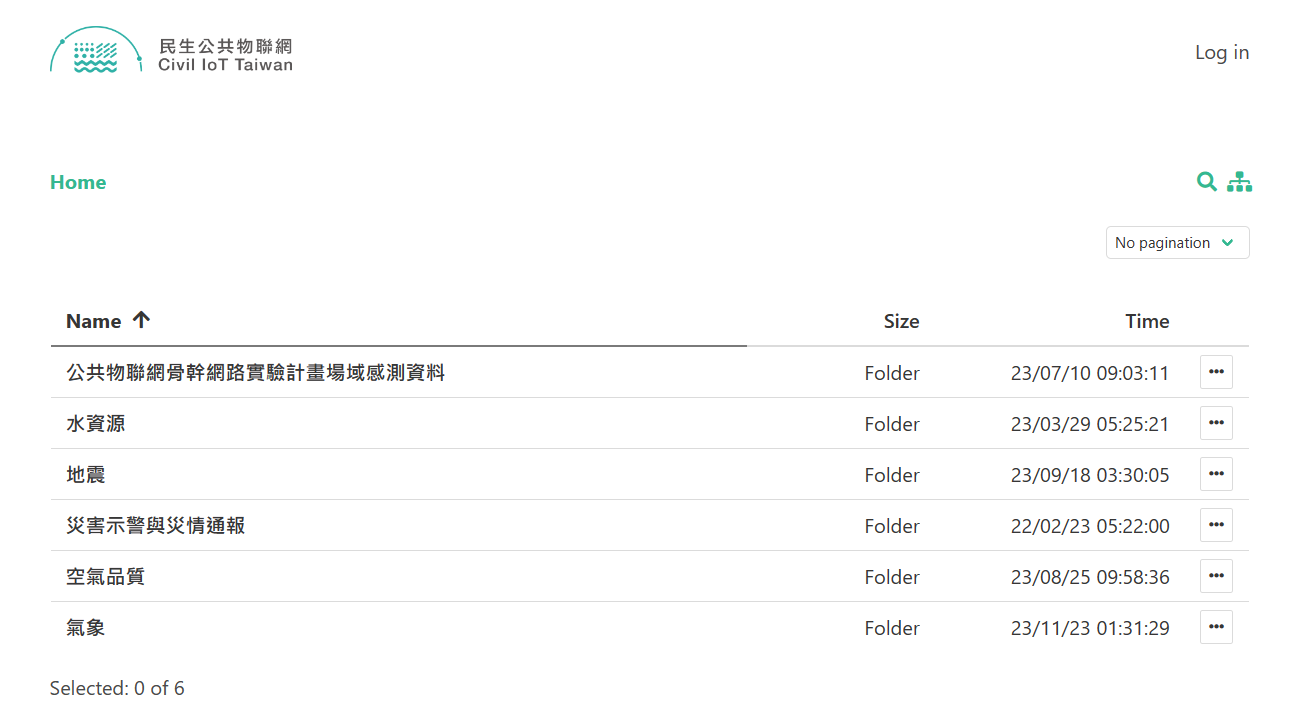
For the situation we want to analyze, we will first go to the Civil IoT Historical Data Area to search for rainfall and rainfall station data by theme, and then download the csv file
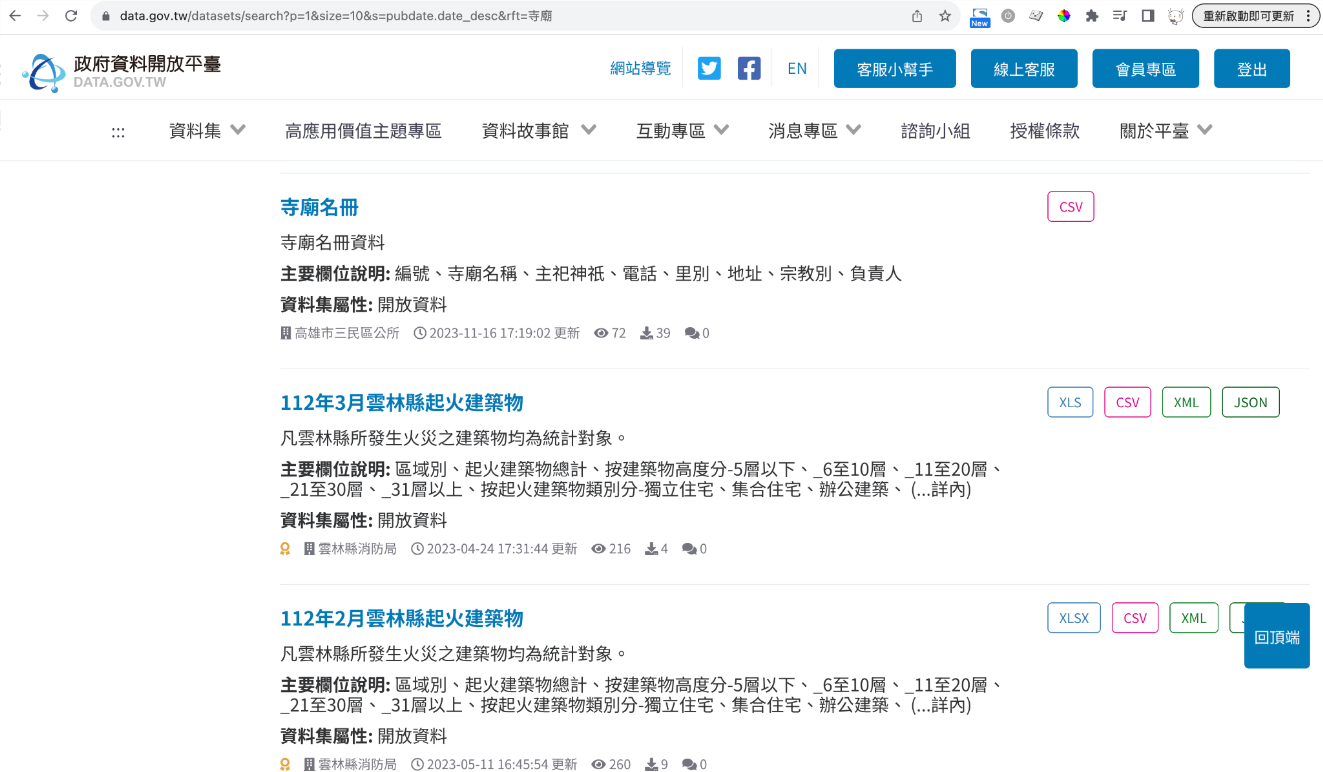
Then go to the government open data platform to search by keyword, and then download the csv file
After getting the data, the most difficult thing for analysts who don't write programs is to merge multiple days of rainfall data, filter rainfall conditions, and associate with rainfall stations to complete data cleaning.
With the help of Botmap, data analysts can analyze in a more efficient way. Just enter the demand in the way of normal conversation, that is, "natural language", and you can step by step according to the command: file download, data preprocessing and visualization chart drawing. Analysts can focus on discussing analysis topics, without worrying about what drawing tools and programming languages to use, greatly improving efficiency.
In the execution screen of Botrun, directly enter: Taiwan Sea Anemone Typhoon, it will automatically help download 2023/9/1~2023/9/5 rainfall and station data
Enter in the screen: Merge the rainfall data from 9/1 to 9/5 and filter the data with rainfall values exceeding 200, and then associate with the station, Botrun will automatically perform data cleaning and merging
Enter: I want to know whether the rainfall situation during the Sea Anemone Typhoon (HAIKUI) has affected the monuments? Botrun will recommend the temple dataset and ask the user if they want to download
When the dataset is confirmed, continue to ask Botrun to draw a map, and put the rainfall data in red and the temple data in blue on the map, and when the mouse points to the data point on the map, it should be able to display the corresponding information, and finally provide the chart html address, so I can see the chart
Botrun has many different role experts who can help data analysts perform data cleaning, chart drawing, and even proposition brainstorming, which is equivalent to having a partner with mathematical ability, a chart making partner. The "Botmap" in Botrun has the following features:
"Botmap" has deep AI capabilities, can focus and converge analysis topics through dialogue with data analysts, and provide recommended datasets to help users effectively mine data.
Data analysts only need to present their needs to "Botmap" through natural language, and "Botmap" can automatically download and preprocess the recommended datasets. After cleaning, the data analyst can easily take away the file, greatly saving time.
According to the needs of data analysts, whether it is a map, bar chart, pie chart, etc., "Botmap" can help draw the most intuitive and persuasive information charts, making the analysis results more convincing.
Whether it's civil IoT open data or other international open data, every user is like an explorer, looking forward to digging precious treasures from the data. Faced with the data in front of them, many people will feel confused: How can I extract meaningful questions from this sea of data for analysis? Even if I find the problem, what software should I use to write programs, clean data and draw charts? "Botrun" is the best partner tailored for you to solve these problems.
Botrun.ai by Botrun has a variety of application scenarios to enhance your work efficiency and assist in operations. If you have any scenarios you want to achieve, feel free to discuss with us for implementation. You can contact us at any time!
Contact Us